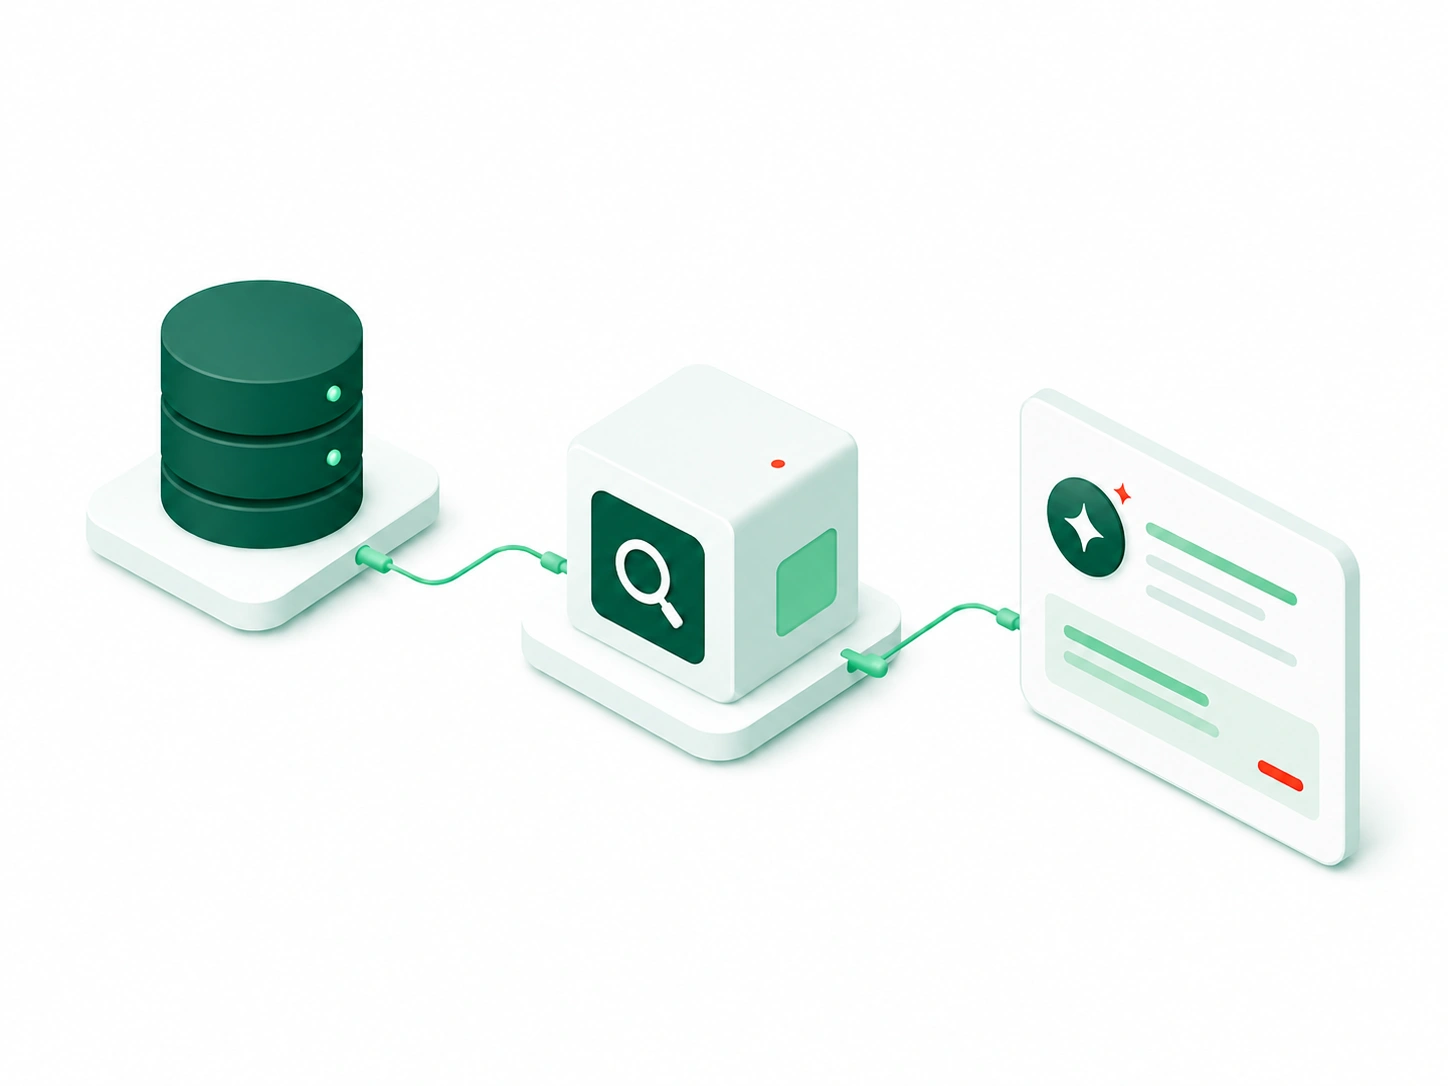
AI-Powered Conversational BI & DataSense Platform
Our bands come from engagements like this one, where users retrieve operational, financial and project insights through natural language queries instead of waiting on an analyst.
See case study















A citation-ready dataset on what AI development actually costs
For most companies a single focused model runs US$20,000–US$60,000, a production build with pipelines and MLOps runs US$60,000–US$150,000 or more, and a proof of concept to validate the idea on your real data starts at US$12,000–US$20,000. These are VOCSO's own published bands, drawn from delivered engagements rather than a rate card.
| Stage | Typical price band | Typical timeline | What it covers |
|---|---|---|---|
| Proof of concept | US$12,000 – US$20,000 | About 6 weeks | Feasibility validated on your real data, plus concrete cost data for the full build |
| Single focused model | US$20,000 – US$60,000 | 2 – 4 months | One model in production — churn, forecasting, scoring, or a RAG assistant |
| Production build with MLOps | US$60,000 – US$150,000+ | 4 – 9 months | Data pipelines, full MLOps, monitoring, and integration into your existing systems |
| Annual run & retraining | 15 – 25% of build cost | Ongoing | Inference, cloud infrastructure, monitoring and periodic retraining |
The four bands are the ranges VOCSO quotes, drawn from delivered engagements rather than a rate card, and they are the same figures published in our AI development cost guide. They are ranges, not medians, and they exclude third-party licence and inference costs, which are billed at cost. Individual project values are never published. The band a quote lands in is decided by two things above all: how ready your data is, and how many of your systems the build has to touch.
The two things that move a quote most are data readiness and integration depth, so every engagement opens with a free 30-minute discovery call before any number is fixed. Demand for exactly this kind of work is being revised upward:
28% to 39% — the 2026 growth outlook for AI application development platforms was raised, as enterprises build custom AI applications rather than buy them. Gartner, September 2026. Source
US$576 billion — AI services spending in 2026, up from US$434 billion in 2025 — the market line AI development engagements are bought from. Gartner, September 2026. Source
US$5–20 million — what Gartner puts on enterprise GenAI deployments aimed at transforming a business model — a different and much larger thing than a single application. Gartner, July 2024. Source
US$462 billion — AI software spending in 2026, up from US$288 billion in 2025. Gartner, September 2026. Source
Our AI development cost guide walks through how each of these bands is actually put together.
This page publishes verified annual salary bands for India only, from AmbitionBox's reported-salary data for 2026, with the sample size behind each one so you can weigh it.
| Role | Reported range (per year) | Sample size | Source |
|---|---|---|---|
| AI Engineer | Rs 15.1 – 16.7 Lakhs | 5,000 salaries | AmbitionBox, 2026 |
| Data Scientist | Rs 15.3 – 16.9 Lakhs | 61,400 salaries | AmbitionBox, 2026 |
| Machine Learning Engineer | Rs 12.6 – 13.9 Lakhs | 9,800 salaries | AmbitionBox, 2026 |
| Data Engineer | Rs 11.6 – 12.8 Lakhs | 110,000 salaries | AmbitionBox, 2026 |
Hourly US and Western European rates are deliberately absent. The sources that publish them block or geo-redirect automated verification, and a figure we cannot trace to its publisher does not belong on a page meant to be cited. They will be added when each one can be read from the organisation that produced it.
We do not publish a multiple, because the US hourly rate it would rest on has not been verified against a primary publisher. What is verified is the shape of the gap.
17.58% — India's approximate share of the global outsourcing market. IBEF, February 2026. Source
US$315.4 billion — India's estimated IT industry revenue in FY26, with US$246.4 billion contributed by exports. IBEF, February 2026. Source
7.54% CAGR — forecast growth for global software outsourcing from 2023 to 2027, with Asia leading at 9.16%. IBEF, February 2026. Source
US$162 billion — Asia/Pacific excluding China and Japan by 2030, up from US$41 billion in 2025 — a 31.7% CAGR for the band India sits in. IDC, September 2026. Source
US$109.1 billion — total US private AI investment in a single year, 2024 — nearly twelve times China's US$9.3 billion. Stanford HAI, AI Index Report, 2025. Source
US$101.64 billion — India's software product industry by 2030. IBEF, February 2026. Source
US$500 billion — the revenue India's technology industry is on track to double to. IBEF, February 2026. Source
Set against that, senior engineering capacity has grown far faster outside the US than the rates have, which is what keeps blended offshore rates below US equivalents for the same seniority.
At least 30% of generative AI projects are abandoned after proof of concept, with escalating costs named by Gartner as one of four causes alongside poor data quality, inadequate risk controls and unclear business value.
30% — of generative AI projects abandoned after proof of concept by the end of 2025. Gartner, July 2024. Source
20% — of AI use cases in infrastructure and operations fail outright, while only 28% fully succeed and meet ROI expectations. Gartner, April 2026. Source
57% — of I&O leaders reported at least one AI initiative failure. Gartner, April 2026. Source
38% — named poor data quality or limited data availability as a direct cause of AI project failure, and another 38% named persistent skill gaps. Gartner, April 2026. Source
70% — of mainframe exit projects started in 2026 will miss their intended benefits, from overestimating generative AI tooling. Gartner, June 2026. Source
45% vs 20% — of finance AI investment leans toward productivity rather than decision quality, which boards value more. Gartner, July 2026. Source
More than twice as likely — functions investing in AI that creates new value propositions, products or markets reported high realised value. Gartner, July 2026. Source
75% — of vendors in the mainframe exit market will pivot their business models or cease operations by 2030. Gartner, June 2026. Source
Projects overrun when the three biggest lines are estimated from a demo rather than from the client’s real data. On a typical VOCSO build, data preparation takes 30–50% of the budget, integration another 15–25%, and run and MLOps 15–25% a year after launch — which is why a proof of concept is priced separately before the full build is quoted.
No approved source publishes an all-in average for a single integration, so here are the components you can price instead, each from a published pricing page or forecast.
US$0.03 per 1,000 tokens — prompt optimisation on Amazon Bedrock. AWS Bedrock pricing, 2026. Source
US$0.15 per million tokens — embeddings for a retrieval-augmented setup on Google AI. Google AI pricing, 2026. Source
US$64 billion — worldwide end-user spending on AI models and platforms in 2026, up 63.4% from US$39 billion in 2025. Gartner, July 2026. Source
210% — forecast 2026 growth for domain-specific and specialised generative AI models — the fastest-growing segment of that market. Gartner, July 2026. Source
8% to 1.7% — how far open-weight models closed the performance gap with closed models on some benchmarks in a single year. Stanford HAI, AI Index Report, 2025. Source
15.8% and 15.2% — average revenue increase and cost savings reported by 822 business leaders surveyed by Gartner — the other half of the arithmetic. Gartner, July 2024. Source
US$28.3 billion — spending on generative AI models in 2026, more than double the US$13.0 billion of 2025. Gartner, September 2026. Source
104.2% — growth in foundation generative AI model spending in 2026, from US$11.4 billion to US$23.4 billion. Gartner, July 2026. Source
36.3% — growth in spending on AI platforms for data science and machine learning, reaching US$26.4 billion. Gartner, July 2026. Source
22.6% — average productivity improvement reported by the 822 business leaders Gartner surveyed. Gartner, July 2024. Source
A single focused model in production runs US$20,000–US$60,000 at VOCSO, which is the closest like-for-like figure we can publish for the work most people mean by a custom LLM integration.
Worldwide AI spending is forecast to total US$2.7 trillion in 2026, a 49.5% increase year over year, of which AI infrastructure alone accounts for US$1.48 trillion.
US$2.7 trillion — worldwide AI spending in 2026, rising to US$3.64 trillion in 2027. Gartner, September 2026. Source
US$1.48 trillion — AI infrastructure spending in 2026, the largest single market, up from US$982 billion in 2025. Gartner, September 2026. Source
US$1.2 trillion — the AI services opportunity Gartner forecasts by 2030. Gartner, September 2026. Source
US$555.2 billion — Asia/Pacific AI and generative AI investment by 2030, up from US$121.5 billion in 2025 — a 35.5% CAGR. IDC, September 2026. Source
US$470 billion — European AI spending by 2030 at a 35.0% CAGR, with generative AI at 55.4% of the market. IDC, September 2026. Source
US$33.9 billion — global private investment in generative AI in 2024, an 18.7% increase on 2023. Stanford HAI, AI Index Report, 2025. Source
78% — of organisations reported using AI in 2024, up from 55% the year before. Stanford HAI, AI Index Report, 2025. Source
US$1,484 billion — AI infrastructure spending in 2026, the largest single market, up from US$982 billion in 2025. Gartner, September 2026. Source
US$303.4 billion — China AI and generative AI spending by 2030, up from US$63.7 billion in 2025 — a 36.6% CAGR. IDC, September 2026. Source
US$88.9 billion — Japan AI spending by 2030, a 39.8% CAGR and the fastest in Asia/Pacific. IDC, September 2026. Source
42.7% — of Asia/Pacific AI spending in 2026 goes to Software and Information Services, ahead of Financial Services at 9.8%. IDC, September 2026. Source
54.9% — of European AI spending in 2026 is software, the fastest-growing segment at a 43.9% CAGR, led by AI platforms at 61.1%. IDC, September 2026. Source
12.6% — of the European AI market is banking in 2026, with financial services overall at 19.2%. IDC, September 2026. Source
41.0% — CAGR for healthcare providers, the fastest-growing European AI industry to 2030. IDC, September 2026. Source
US$1.25 billion — India's government AI commitment in 2024, alongside Canada's US$2.4 billion and Saudi Arabia's US$100 billion. Stanford HAI, AI Index Report, 2025. Source
Nearly 90% — of notable AI models in 2024 came from industry, up from 60% in 2023. Stanford HAI, AI Index Report, 2025. Source
US$4.5 billion — UK private AI investment in 2024, against the United States' US$109.1 billion. Stanford HAI, AI Index Report, 2025. Source
Plan for roughly 15–25% of the build cost per year, covering inference, cloud infrastructure, monitoring and the periodic retraining a model needs as your data shifts.
US$23.3 billion vs US$19 billion — global spending on inference overtakes spending on training in 2026 for the first time — the run, not the build, is now the larger line. Gartner, August 2026. Source
96.4% — growth in worldwide AI-optimised infrastructure-as-a-service spending through 2026, reaching US$42 billion. Gartner, August 2026. Source
280-fold — the drop in inference cost for a system performing at the level of GPT-3.5, between November 2022 and October 2024. Stanford HAI, AI Index Report, 2025. Source
30% a year — the decline in AI hardware costs, with energy efficiency improving 40% a year alongside it. Stanford HAI, AI Index Report, 2025. Source
US$287 billion — total infrastructure-as-a-service spending in 2026, growing 29.3%; AI-optimised IaaS is about 15% of it. Gartner, August 2026. Source
180% — growth in AI-optimised IaaS spending during 2025, to US$21.5 billion. Gartner, August 2026. Source
The per-unit side of the bill keeps falling. What does not fall is the cost of a model degrading unnoticed as your data drifts, which is why monitoring is budgeted rather than assumed.
Yes, and you do not need to ask. Each figure is printed with the organisation that published it and the year, so cite the original publisher — Stanford HAI, IBEF, AmbitionBox, AWS or Google — rather than this page. A link back to VOCSO is welcome but not a condition.
Three tests, all of which have to pass. The source URL has to return a live page, the number has to appear on that page rather than in something it links to, and the surrounding context has to match the claim we are making. A figure that fails any one of the three stays off the page, even when it is widely quoted elsewhere.
One gap remains: hourly AI developer rates for the US and Western Europe, and therefore a direct India-versus-US multiple. Glassdoor redirects this network to its Indian site and renders figures in rupees, and the US Bureau of Labor Statistics returns an error to it, so neither could be verified. Everything else on this page has been traced to the organisation that published it, including the Gartner and IDC figures, which were read from their own press releases rather than from coverage of them.
Original sources only. Where a figure reaches us through an intermediary — IBEF reporting a NASSCOM number, for example — the intermediary is named as the publisher and the primary link is chased before launch. Roundup articles that quote other roundups are not used as sources.
Every figure was last re-checked against its primary source in October 2026. The page is reviewed whenever a source publishes a new edition — the Stanford HAI AI Index annually, IBEF with its industry updates, and vendor pricing pages whenever they change.
It is the full set. The page shows the figures that answer a specific question; the CSV carries all 57 verified rows with the publisher, publication date, source URL and the date we verified each one. It is a plain comma-separated file — use it as you like, citing the original publisher of each figure.















Our bands come from engagements like this one, where users retrieve operational, financial and project insights through natural language queries instead of waiting on an analyst.
See case study  <12 Seconds
 10+ Systems
 Days → Minutes
 95%+

The figures above are the market. These are the firms that acted on them, in their own words.
View all client testimonials“Vocso team has really creative folks and is very co-operative to implement client project expectations. MicroSave Consulting had great experience working with Anju and Prem.”

“Working with Deepak and his team at Vocso is always a pleasure. They employ talented staff and deliver professional quality work every time.”

“We love how our website turned out! Thank you so much VOCSO Digital Agency for all your hard work and dedication.”

“VOCSO SEO & SEM services helped me find new customers in a small budget. Their advanced SEO strategies made us visible to everyone.”

“Vocso team has really creative folks and is very co-operative to implement client project expectations. MicroSave Consulting had great experience working with Anju and Prem.”
“Working with Deepak and his team at Vocso is always a pleasure. They employ talented staff and deliver professional quality work every time.”
“We love how our website turned out! Thank you so much VOCSO Digital Agency for all your hard work and dedication.”
“VOCSO SEO & SEM services helped me find new customers in a small budget. Their advanced SEO strategies made us visible to everyone.”
The figures above are the market. What you pay depends on your data, how many systems the build has to touch, and how much has to keep running after launch. Our cost guide walks through how that budget is actually put together.
[email protected] — no forms, no funnels.
The services these figures apply to — from custom model builds and RAG systems to the Python backends and automation they run on.

Certified, partnered and independently rated