
Table of Contents
RAG Development
Retrieval-Augmented Generation for grounded enterprise AI
- ✔️ Combines internal knowledge base with LLM
- ✔️ Reduces hallucinations, boosts trust
- ✔️ Powered by vector search + embeddings
- ✔️ Perfect for enterprise documentation, SOPs
![]()
When a growing leased line ISP approached us with a specific operational challenge, we knew they didn’t need bloated dashboards or enterprise tools. They needed something lean, reliable, and deployable on-site — without cloud dependencies or ongoing costs.
So, we built exactly that. A modular, API-first IP uptime monitor, built using Python + FastAPI, with a clean frontend and a heartbeat running from a Raspberry Pi — all tailored for ISPs.
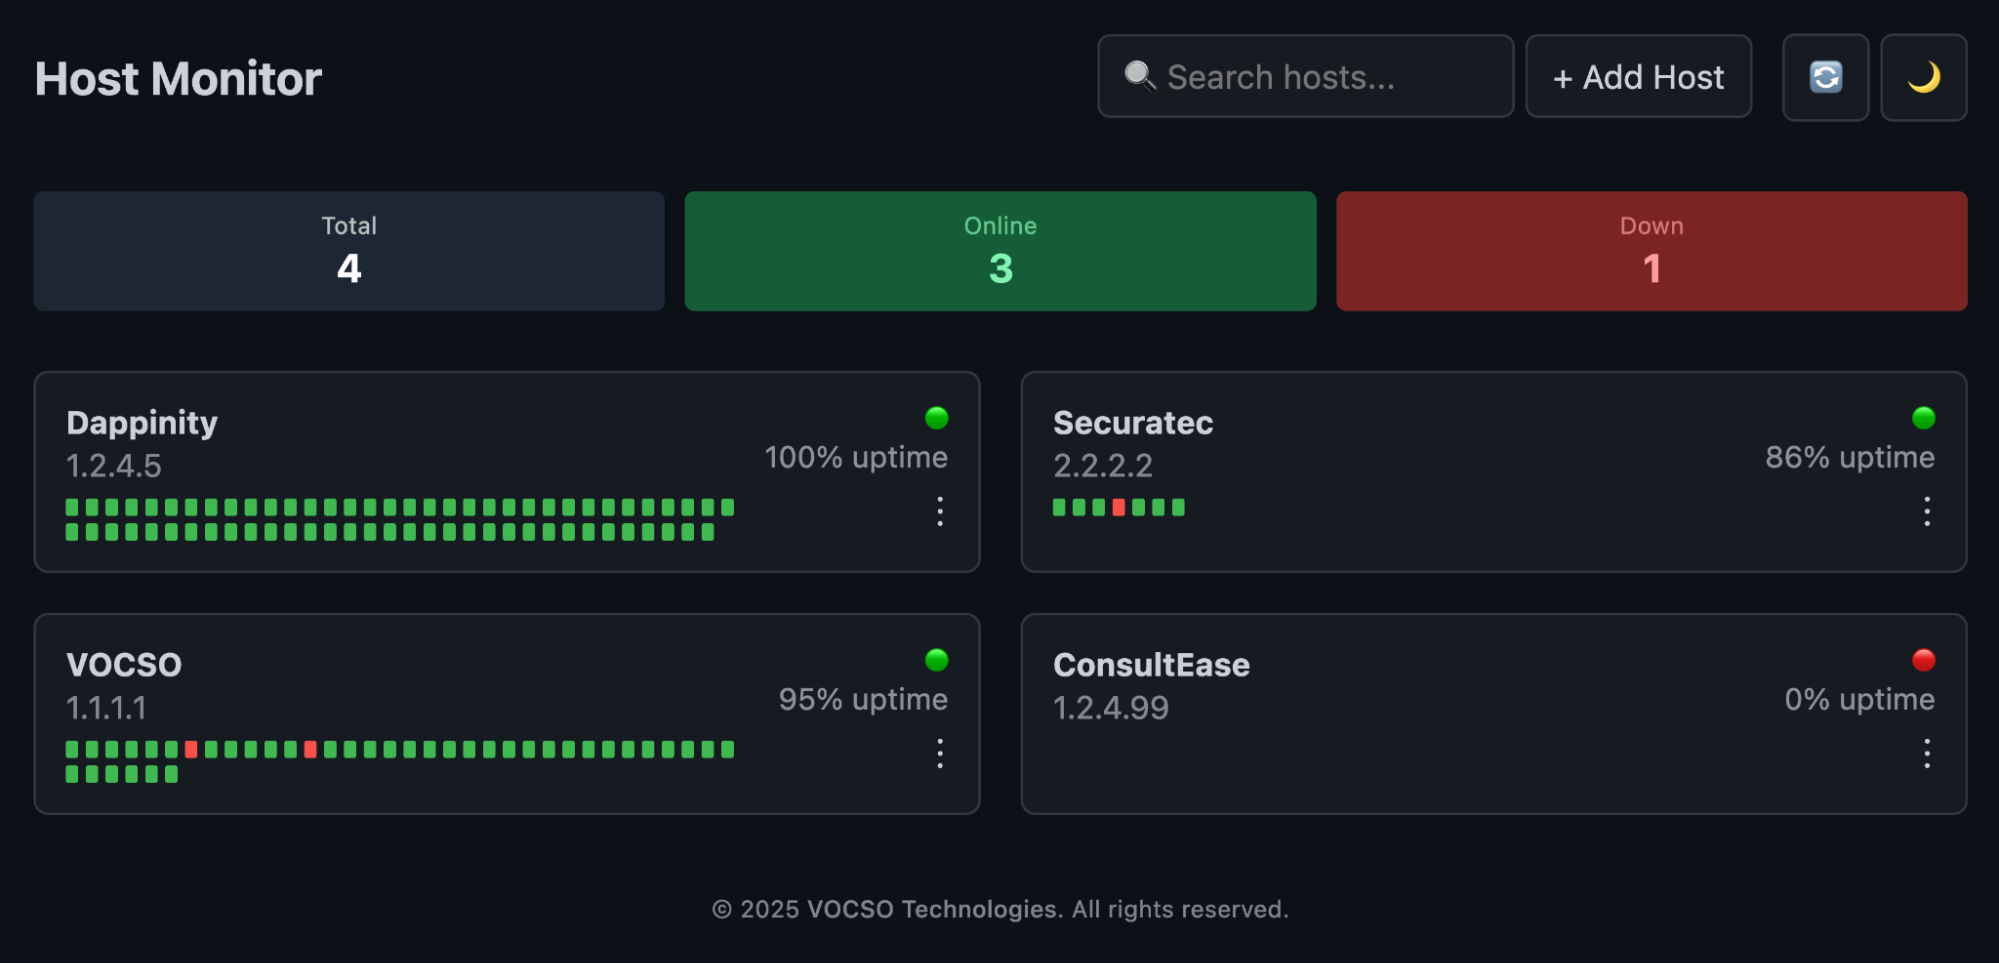
Table of Contents
The Problem
The client ISP had dozens of client IPs to monitor. Their pain points were clear:
- No centralized dashboard to check real-time status.
- No historical uptime visibility.
- Manual checks & delayed incident response.
- Alerting was ad hoc at best.
- Wanted complete control and local deployability.
Our Solution
We engineered a plug-and-play uptime monitor using:
1. FastAPI as the backend service.
2. HTML/CSS/JS frontend for easy status visualization.
3. A custom monitor.py script with:
- Smart pinging logic
- Retry mechanism
- Uptime calculation
- Email throttling
- JSON-based storage (no DB required)
4. Deployed and running 24×7 via systemd on Raspberry Pi 3.
The Monitoring Logic: monitor.py
def monitor():
while True:
for host in hosts:
if not ping(host["ip"]):
host["fail_count"] += 1
else:
host["fail_count"] = 0
host["statusCurrent"] = True
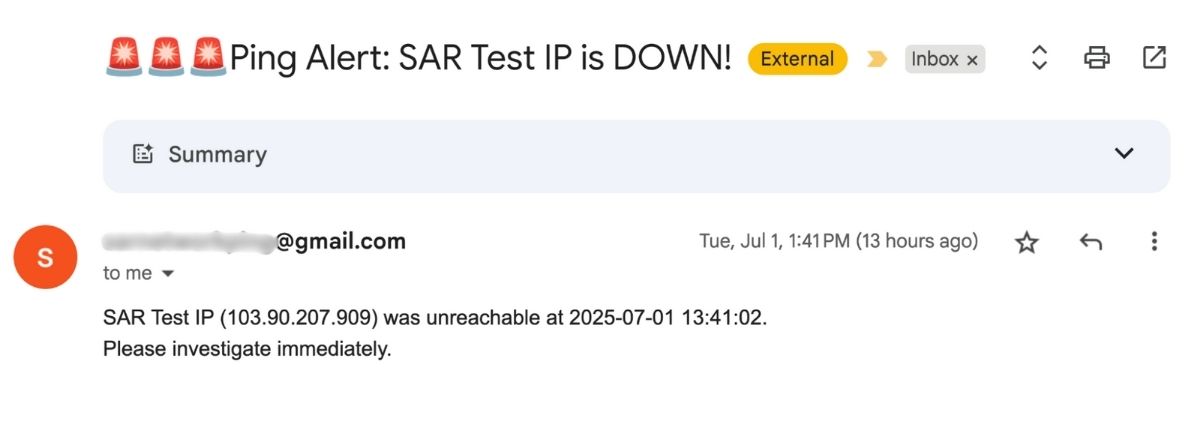
# 10 consecutive failures → alert
if host["fail_count"] >= 10 and should_send_email(host):
send_email_alert(host)
host["last_alert_time"] = time.time()
update_status_history(host)
save_to_json("hosts.json", hosts)
time.sleep(config["interval"])Email Throttling Example
def should_send_email(host):
    return (time.time() - host.get("last_alert_time", 0)) > config["email_cooldown"]
Frontend: Real-Time Dashboard
The FastAPI backend serves a web UI to view:
- Uptime % of each host
- current status
- Hostname + IP (IP dimmed)
- Status dot trail
- Add/Edit/Delete UI
- Dark/Light theme toggle
- Auto-refresh every 10 sec
- Stats summary at top
Here’s a sample HTML placeholder for each card:
<div class="host-card">
  <div class="host-header">
    <div class="host-info">
      <div class="host-name">Server A</div>
      <div class="ip-address">192.168.0.1</div>
    </div>
    <div class="host-meta">
      <div class="status up-status">🟢</div>
      <div class="uptime">98% uptime</div>
    </div>
  </div>
  <div class="status-line">
    <div class="dot up"></div><div class="dot down"></div>...
  </div>
</div>
SystemD Deployment on Raspberry Pi
We packaged monitor.py as a service:
[Unit]
Description=IP Monitor Service
After=network.target

[Service]
ExecStart=/usr/bin/python3 /home/pi/monitor.py
WorkingDirectory=/home/pi
Restart=always

[Install]
WantedBy=multi-user.target
Enable and start:
sudo systemctl enable monitor
sudo systemctl start monitor
Secure & Lightweight
- API runs on port 8000 — open it via UFW or iptables.
- SMTP settings (for Gmail or custom SMTP) are stored in config.json.
- Only .json files used for storage — no database dependencies.
- Works perfectly on Raspberry Pi 3 but also easily deployable on any Linux cloud VM (like AWS Lightsail).
Results
The monitor is now live and quietly humming in the corner of the ISP’s NOC room:
- 10-second real-time status refresh
- 100% self-hosted
- No cloud costs
- Faster incident detection
- Peace of mind for network admins
Why This Worked
This wasn’t just code. This was engineered:
- To be lean & fast (perfect for RPi)
- For real-world ISP use (retry + email cooldown)
- Without vendor lock-in
- With visual clarity and zero devops bloat
Looking Ahead
Future extensions may include:
- Telegram/Slack alerts
- Advanced reporting
- Dockerization
- Role-based login (if needed)
Beyond ISP Monitoring, Other Real-World Use Cases for This System
While the original deployment was engineered to monitor leased line IPs for a regional ISP covering full stack aspects of the project having plain designing+coding and api’s integration, its flexible architecture allows adaptation to several practical monitoring scenarios:
1. Website Uptime Monitoring
Use Case: Monitor client portals, marketing websites, or critical APIs.
Modification: Swap ping() with an HTTP GET check.
Bonus: Extend to log response times and alert for slow responses.
def is_website_up(url):
    try:
        res = requests.get(url, timeout=5)
        return res.status_code == 200
    except:
        return False
2. SSL Certificate Expiry Monitoring
Use Case: Track SSL certs of websites or subdomains and alert before expiry.
Why It Matters: Expired certs break HTTPS and damage trust.
Enhancement: Add a scheduled job to check SSL expiry dates.
import ssl, socket
from datetime import datetime

def get_ssl_expiry(hostname):
    context = ssl.create_default_context()
    with socket.create_connection((hostname, 443)) as sock:
        with context.wrap_socket(sock, server_hostname=hostname) as ssock:
            return ssock.getpeercert()['notAfter']

# Example usage
expiry = get_ssl_expiry('example.com')
expiry_date = datetime.strptime(expiry, '%b %d %H:%M:%S %Y %Z')
days_remaining = (expiry_date - datetime.utcnow()).days
3. Internal Services Monitoring (Intranet/DevOps)
Use Case: Monitor Jenkins, self-hosted Git, or database servers on internal IPs.
Why It Works: No reliance on external tools. Fully in-network.
Deploy: On internal Linux VMs or office Raspberry Pis.
4. Branch Network Device Monitoring
Use Case: IT teams at HQ monitor routers, leased lines, and gateways in branch offices.
Architecture: Use a Raspberry Pi or Linux server in each branch.
Scalable: Works for a few or hundreds of remote sites.
5. Educational Institutions
Use Case: Monitor IP-connected ERP servers, attendance devices, or firewalls.
Highlight: Ideal for low-budget, low-maintenance campus IT setups.
6. IoT Device Uptime & Ping Monitoring
Use Case: Ensure remote edge devices or smart gateways are online.
Why It Fits: Ping-based check is ideal for constrained environments.
Next Level: Combine with telemetry or MQTT-based checks.
Highly Modular, Infinitely Adaptable
This system isn’t a rigid SaaS product — it’s a flexible, self-hostable uptime monitor engine with:
- IP or domain checks
- Email alerts via SMTP
- Custom logic with retry/backoff
- Responsive Web UI built in HTML/CSS/JS
- Persisted JSON backend, no DB needed
- Auto-refresh + visual stats dashboard
- Simple enough to run on Raspberry Pi, powerful enough for cloud
What started as a simple uptime monitor turned into a robust, production-grade tool — deployed on constrained hardware, running custom logic, automating alerts, and serving a clean, interactive UI. Backend development and Custom API development skills are crucial prerequisites for making this uptime monitor leveraging knowledge of programming along with latest technologies like Raspberry Pi .
This is the kind of work we love: taking on real-world constraints, building lean systems with just the right stack, and shipping something that just works — simply, reliably, and intelligently.
Whether it’s a custom monitoring system, an AI-powered assistant, or automating workflows at scale — if you’ve got a complex challenge, we’re ready to engineer a solution that feels effortless on the outside and powerful underneath.